OC Equity Map
The Orange County Equity Map (OC Equity Map) is a data platform that spotlights social and health disparities in Orange County neighborhoods across multiple dimensions with a specific focus on the impact from COVID-19. This interactive map visualizes Orange County into 580 census tracts and displays the scores from the Social Progress Index (SPI), CDC Health Indicators, and population demographic data as well as overlays additional information that can be customized for a variety of different use cases.
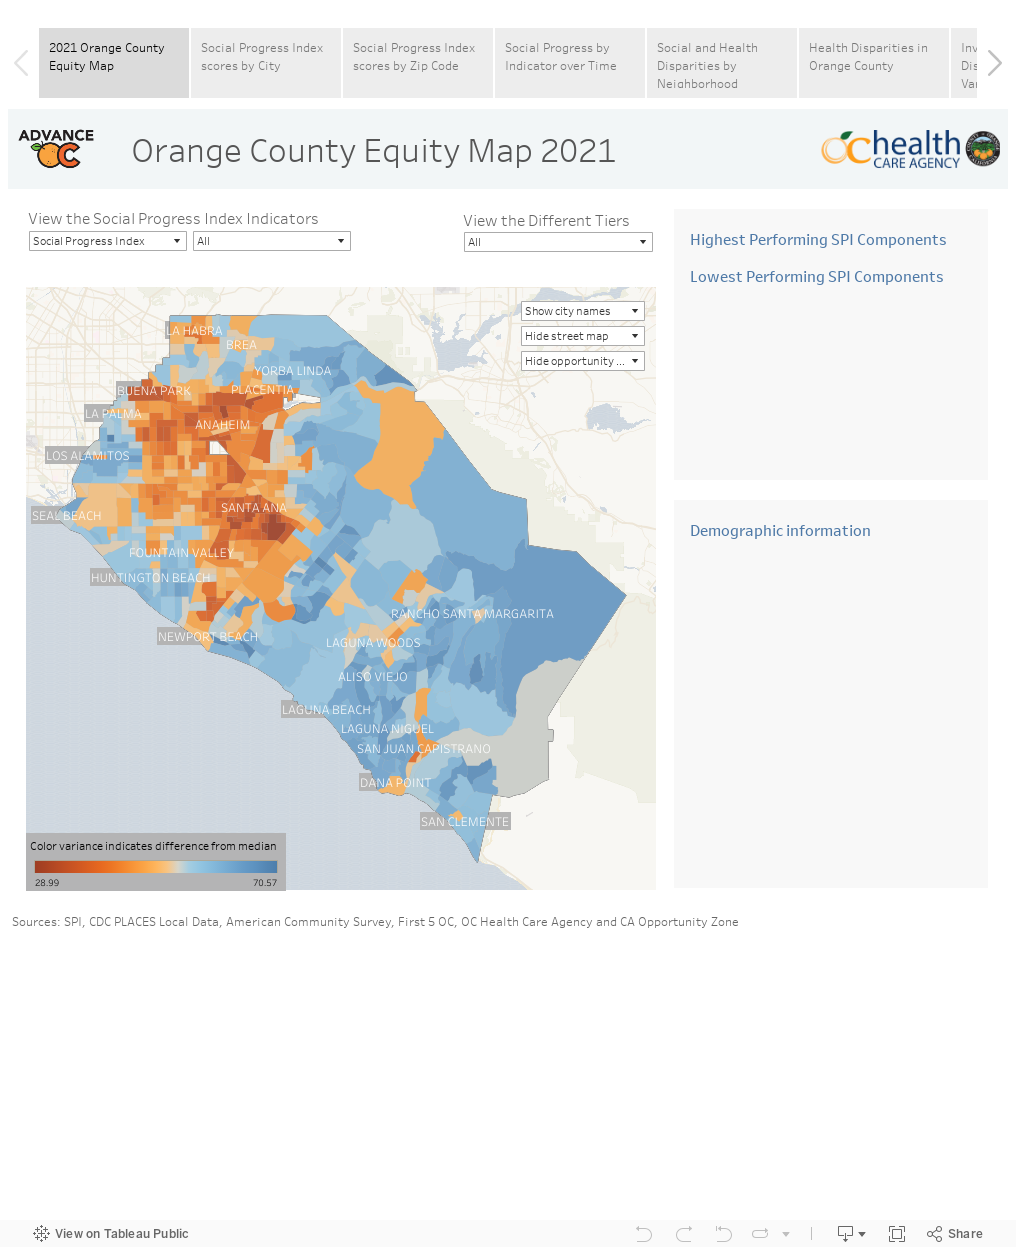
Mapping the Disparities
The OC Equity Map spotlights social and health disparities in Orange County neighborhoods. This interactive map visualizes 580 census tracts across the county and displays scores from the Social Progress Index (SPI), Centers for Disease Control (CDC) Health Indicators, and population demographic data. This tool allows our communities to identify what health inequities exist and where they are most felt, so we can work together to eliminate them.
The OC Equity Map is powered by our consultant partner AdvanceOC.
