Poverty and health are deeply connected. Poverty limits opportunities to protect or enhance health, and introduces direct threats to health. For example, poverty limits access to fresh foods which protect against cancer, heart disease and diabetes. Generational poverty in Orange County is concentrated by place and race. While the root causes of poverty are complex, we can create a future with increased opportunities to disrupt the cycle of poverty. Conversely, families with higher incomes can more easily afford everyday supports that reduce stress and mental health services.
How Are Income and Poverty Affecting the Health of Orange County Residents?
Median Household Income
Why is this important?
Median household income reflects the relative affluence and prosperity of an area. Areas with higher median household incomes are likely to have more educated residents and lower unemployment rates. Higher employment rates lead to better access to health care and better health outcomes. Areas with higher median household incomes also have higher home values and their residents enjoy more disposable income.
Income, as a key social determinant, has a significant impact on health outcomes. Orange County has one of the highest annual median incomes in the U.S., but also bears some of the highest costs of living. In 2021, the median household income in Orange County was $100,485; however, Orange County was also ranked as one of the 10 most expensive counties according to the Insight Center (Insight Center, 2022).
The California Family Needs Calculator published by the Insight Center reports that a family of four with two school aged children needs to earn an hourly wage of $23.99 per adult in the household or $101,336 as a household to pay for basic living expenses in Orange County.
-
Median Household Income
$100,485Orange County
-
$84,097
California
-
$69,021
The United States of America
Source: American Community Survey, 2017-2021.
-
Poverty Rate of the Population
9.9%Orange County
-
12.3%
California
-
12.8%
The United States of America
Source: American Community Survey, 2021.
Monthly Costs in Orange County, CA, 2021
| Rent | $2,232 |
| Utilities | $99 |
| Child Care | $1,986 |
| Health Care | $628 |
| Food | $1,005 |
| Transportation | $654 |
| Miscellaneous | $661 |
| Taxes | $1,612 |
| Child Care Tax Credit (-) | ($100) |
| Child Tax Credit (-) | ($333) |
| Earned Income Tax Credit (-) | ($0) |
| Child Care Tax Credit (-) | ($100) |
| Self-Sufficiency Standard* | |
|---|---|
| Hourly Wage | $23.99 |
| Monthly Wage | $8,445 |
| Annual Wage | $101,336 |
| Emergency Savings (Monthly) | $177 |
| *Self-Sufficiency Standard-How much income a family must earn to meet basic needs. All following values are per household. | |
Median Household Income (measurement period: 2005-2019)
Orange County
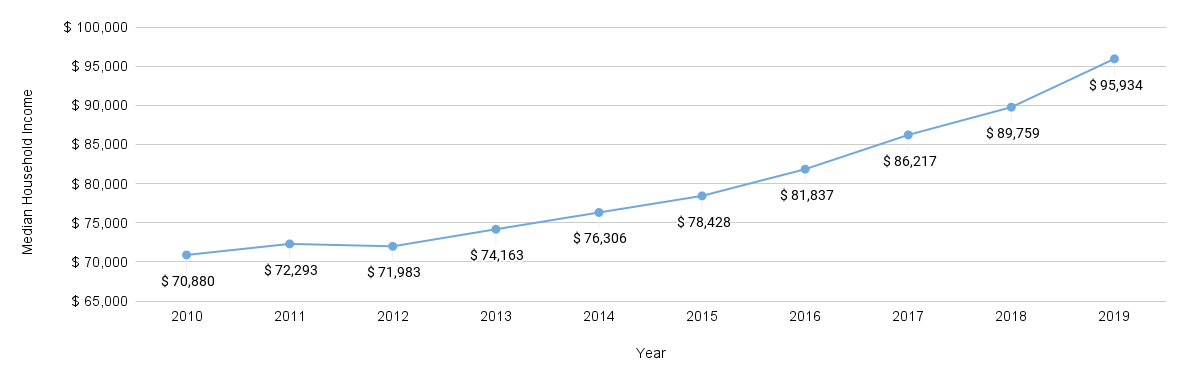
Source: American Community Survey, 2019.
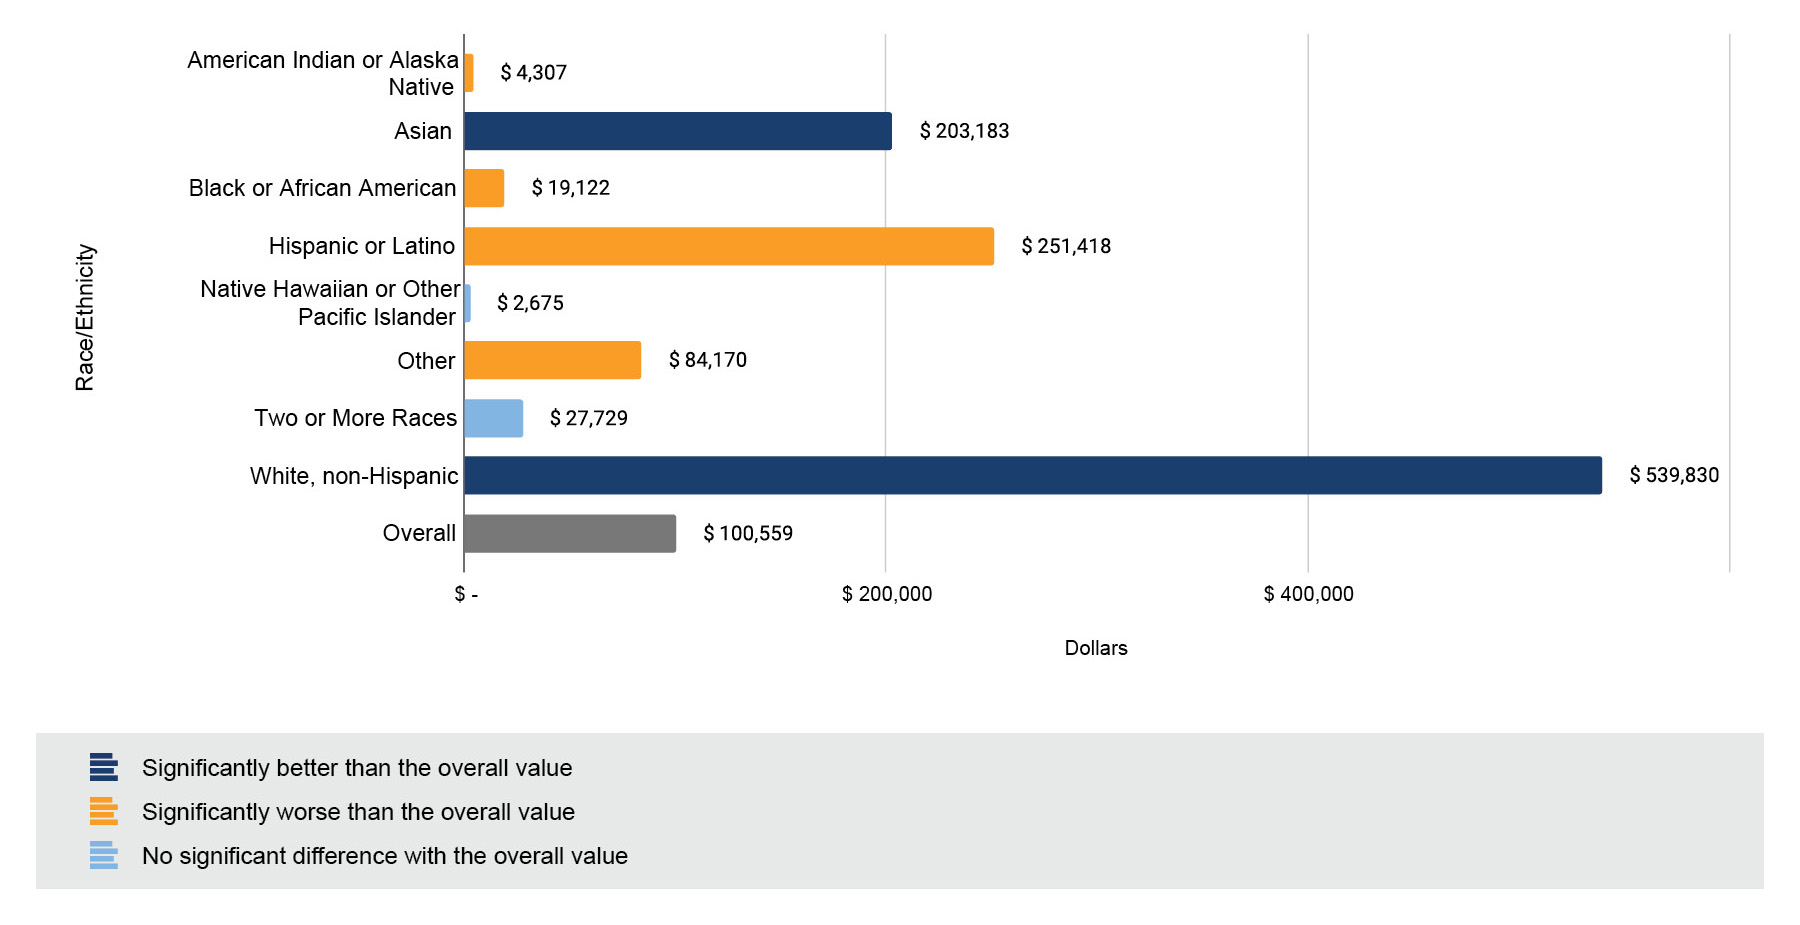
Asian American and White Orange County residents were reported to have the highest median income. In contrast, the Native American/Alaska Native, Black/African American and Hispanic/Latino had the lowest median income in the county.
How are Housing Costs Affecting Health?
Why is this important?
Housing should represent a place of safety, stability, and shelter and not a place of stress, strain, or insecurity. When people struggle to afford a place to live, that financial strain makes it harder to make other healthy choices, like access to fresh foods or seeing a doctor when you're sick. Moreover, disruptive events, such as suddenly losing your home, can lead to a snowball of negative impacts on health, such as mental health challenges.
Spending more than 30% of one’s household income on rent can create financial hardship, especially for lower-income renters. With a limited income, paying a high rent may not leave enough money for other expenses, such as food, transportation and medical. Moreover, high rent reduces the proportion of income a household can allocate to savings, which is necessary for financial stability. As indicated below, more than 56% of Orange County residents spend more than a third of their income on rent, a percentage much higher than the State and National averages.
-
Percentage of Renters in Orange County Who Spend More Than 30% of Their Income on Rent
56.6%Orange County
-
54.8%
California
-
49.6%
The United States of America
Source: American Community Survey, 2015-2019.
“Households of color in California are over-represented among essential workers who have borne the brunt of a dual health and economic crisis. While making up 39% of the population, Latino workers are 71% of California’s cooks, 77% of the state’s dishwashers, and more than 80% of the state’s housekeepers. Asian people make up 90% of manicurists, 24% of wait staff, and 20% of home health and personal care aides.”
Source: The Cost of Being California 2021.
Renters Spending 30% or More of Household Income on Rent (measurement period:
2005-2019)
Orange County
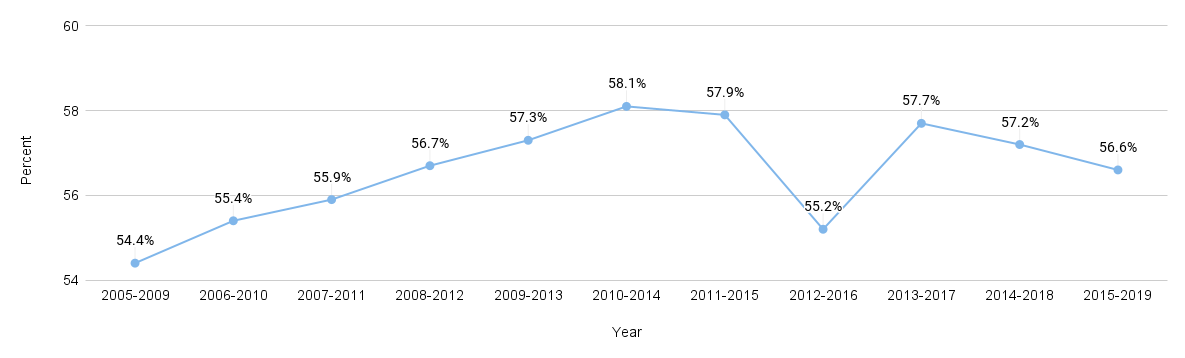
Source: American Community Survey, 2005-2019.
Renters Spending 30% or More of Household Income on Rent by Age (2019)
Orange County
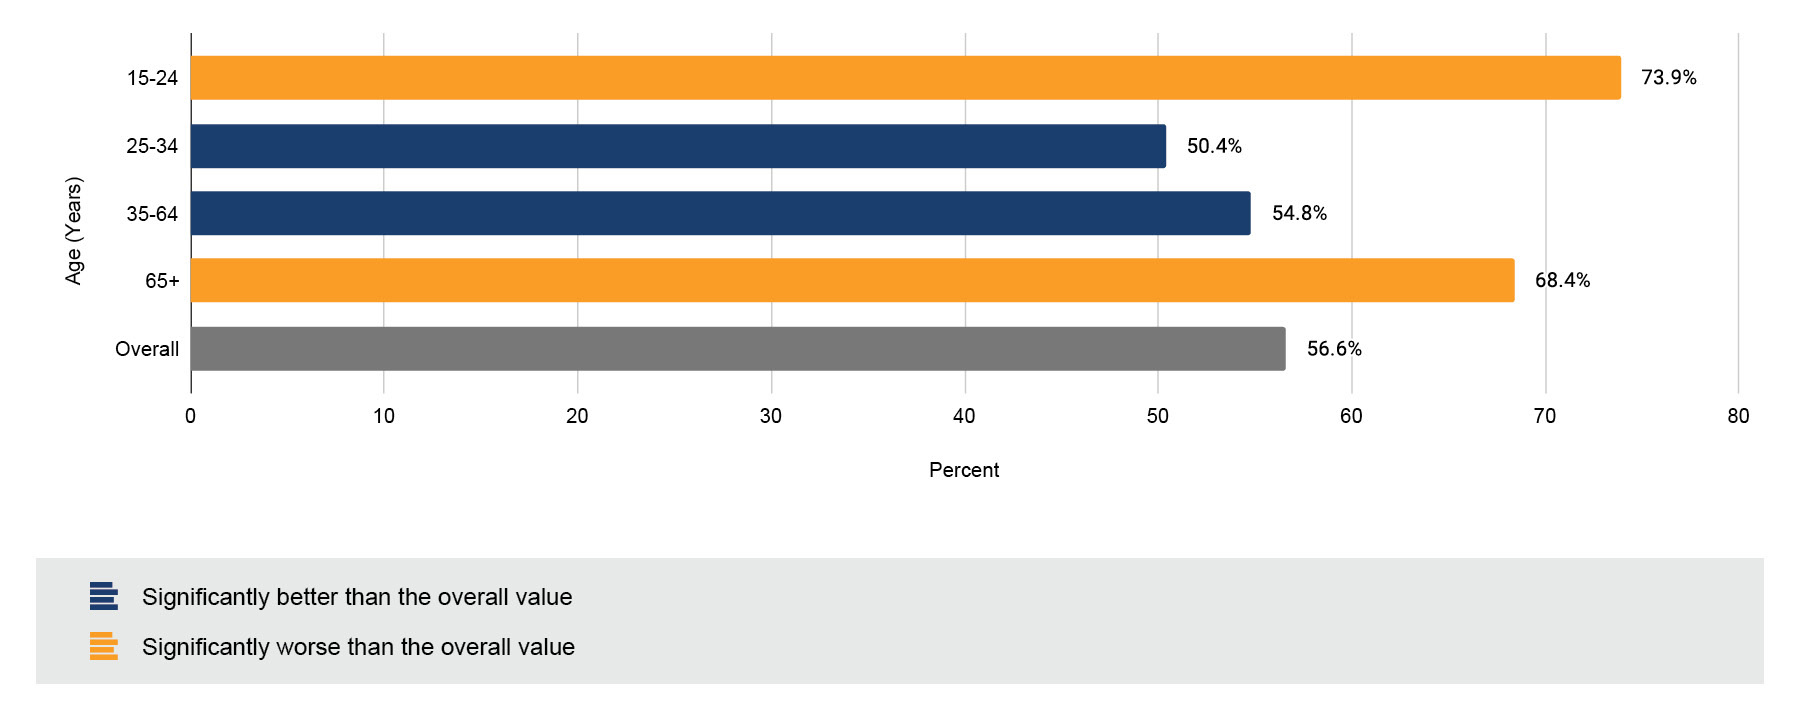
Source: American Community Survey, 2015-2019.
Those in the 15-24 age group were most likely to spend 30.0% or more on rent. Older adults were also significantly more likely to spend a significant portion of their income on rent. Both of these age groups are particularly vulnerable as they represent the youngest and oldest citizens in Orange County.
How is Homelessness Affecting Health?
Why is this important?
In Orange County, the number of people experiencing homelessness has recently increased, as has the proportion of people experiencing homelessness who are minors. In 2021, the Homeless Data Integration System (HDIS) reported that 16,250 people accessed the Orange County Continuum of Care homelessness response system. In May 2022, a total of 5,718 persons experiencing homelessness were counted through the 2022 Point In Time Count effort. A little less than half of the homeless population is sheltered, which makes it difficult to properly assess the state of homelessness within the county. While a majority of the sheltered were individuals, there were also a large number of families with children who rely on government assistance and community resources such as food banks.
Approximately 20% of people nationwide become homeless due to mental illness, substance abuse or a disabling condition that may cause a person to become unemployed, or any major illness that results in massive health care expenses. Homelessness then increases the risk of developing health problems and can also turn a relatively minor health problem into a serious illness. Homelessness also complicates the treatment of many illnesses because people do not have the support or place to recover.
Homelessness is much more than simply not having a roof over your head. It is complex, and inherently connected to the state of your health: poor health can lead to homelessness, and homelessness can lead to poor health. Individuals experiencing homelessness have been shown to have more health issues, suffer from preventable illnesses at a greater rate, experience longer hospital stays, and have a greater risk of premature death than their non-homeless peers.
How is Education Affecting Health?
Individuals with higher education are more likely to have jobs that provide health promoting benefits such as health insurance, paid leave, and retirement. People who do not finish high school are more likely than those who finish high school to lack the basic skills required to function in an increasingly complicated job market and society. Adults with limited education levels are more likely to be unemployed, on government assistance, or involved in crime.
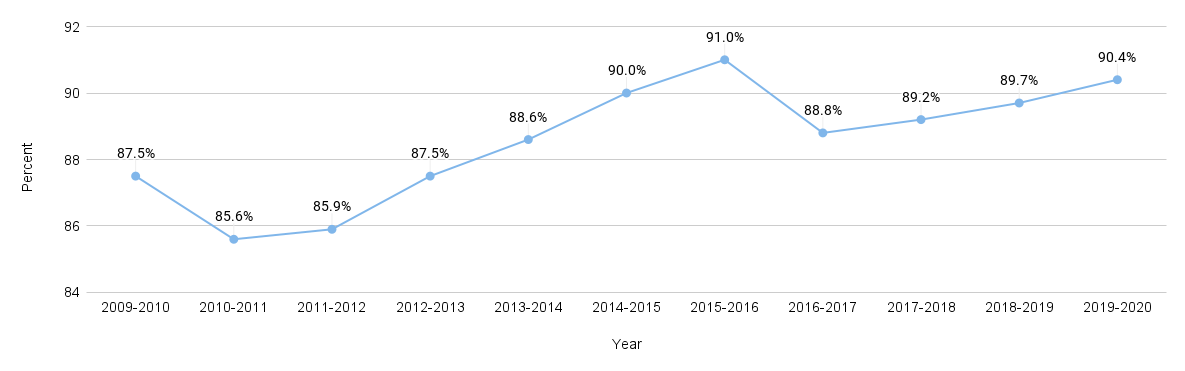
The Healthy People 2030 national health target is to increase the proportion of high school students who graduate in four years to 90.7 percent. In Orange County, the rate of high school graduation was 90.4% by 2020, which was much higher than the state and U.S. rates.
-
High School Graduation
90.4%Orange County
-
84.3%
California
-
85.3%
The United States of America
High School Graduation (measurement period: 2009-2020)
Orange County
Violent Crime Rate
Why is this important?
A violent crime is a crime in which the offender uses or threatens to use violent force upon the victim. According to the FBI's Uniform Crime Reporting Program, violent crime includes four offenses: murder and nonnegligent manslaughter, rape, robbery, and aggravated assault. Violence negatively impacts communities by reducing productivity, decreasing property values, and disrupting social services.
-
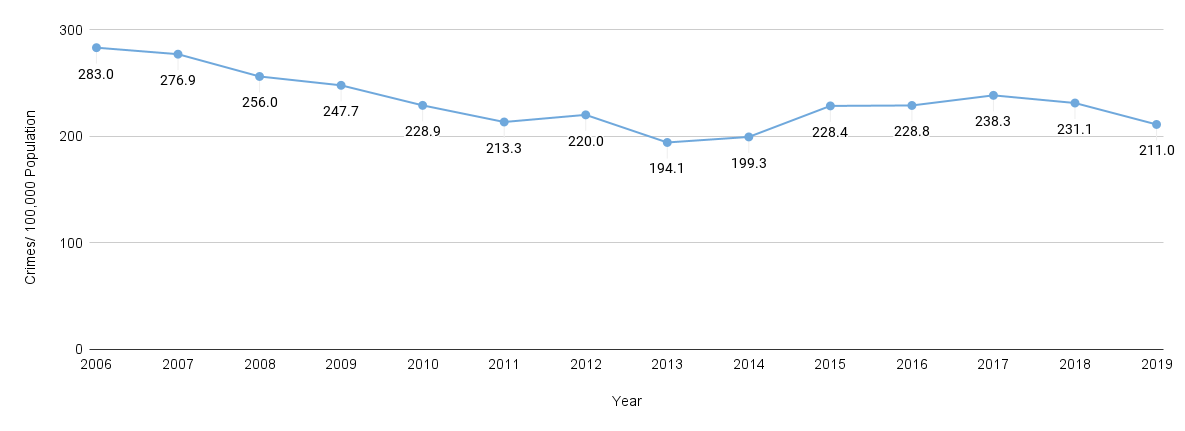
Violent Crimes Per 100,000 Population
211.0Orange County
-
437.9
California
-
380.6
The United States of America
Violent Crimes per 100,000 Population (measurement period: 2006-2019)
Orange County
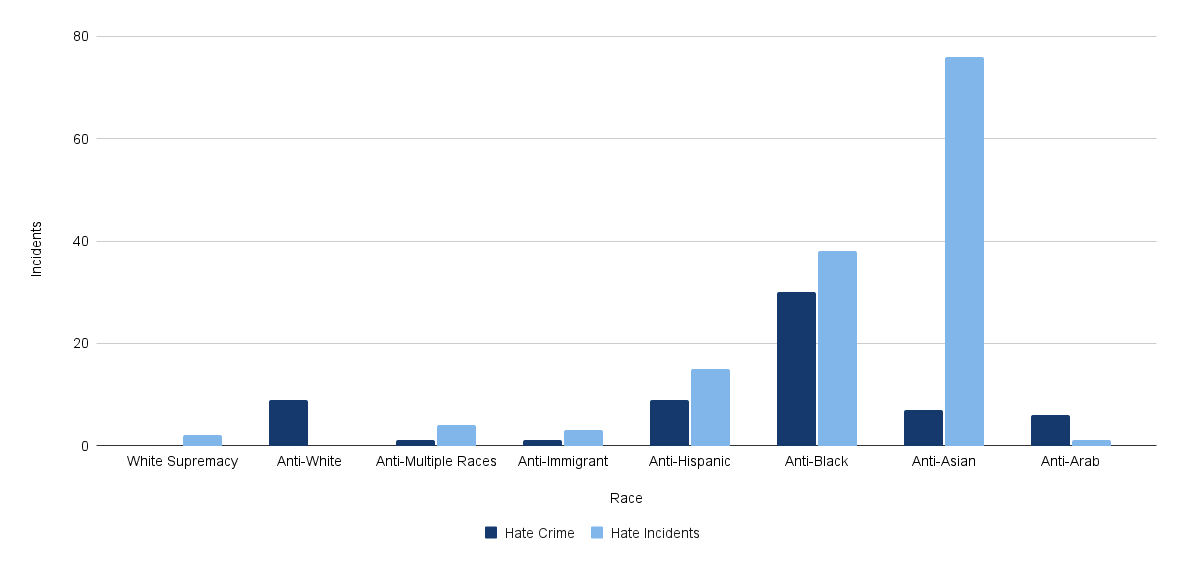
According to the May 2021 Stop AAPI Hate Mental Health Report, Asians reported to be more stressed by anti-Asian hate than the COVID-19 pandemic itself. One in five Asians who have experienced racism shows racial trauma, which is the psychological and emotional harm caused by racism. They also have heightened symptoms of depression, anxiety, stress, and physical distress. Experiences of racism during the COVID-19 pandemic were more strongly associated with symptoms of post-traumatic stress disorder (PTSD) (Stop AAPI Hate Mental Health Report, 2021).
The Black community has also experienced a significantly higher volume of anti-Black hate crimes. In Orange County, Black men and women have been subjected to hate crimes at a rate far more than their share of the population, according to the recently released 2020 Hate Crime Report by the Human Relations Commission. In the county, Black people account for 2% of the general population but experienced nearly one-third of all targeted hate crimes in the year 2020. Since 2003, the Human Relations Commission has reported that Black people have nearly always been targeted more often and/or disproportionately victimized than any other community. The year that stands out is 2019, when the Black community were victims of 53% of all recorded hate crimes.
Hate Crimes & Hate Incidents in Orange County
Learn more about health in our community
Select a health factor below to learn more about how our environment, our social context, and our behaviors impact our health. You'll also find local resources to improve health for you and your family!